Emergency Hotline: 855-767-2482

2025 Water Quality Reports
Each year, we produce a Water Quality Report that contains important information about the high-quality water Greenville Utilities treats and delivers to our customers. There is also a report available for our Bethel Customers. Our goal is to provide you with a safe and dependable supply of drinking water.
Click here to view the Water Quality Report (PDF, 8.18 MB). Click here to view the Bethel Water Quality Report (PDF, 7.46 MB).
This page contains all of the information in the printed version and is provided to make translation to other languages simple. To translate this page, simply click on the flag in the lower-left corner and select the language of choice.
GUC System Number - 04-74-010
Bethel System Number - 04-74-030
Report Summary
This annual report shows that Greenville Utilities meets all Federal and State standards for safe drinking water and had no violations in 2024.
This annual report also shows that Bethel meets all Federal and State standards for safe drinking water and had one monitoring violation in 2024. The second quarter disinfection byproduct samples were collected and shipped to a contract laboratory for analysis. The samples were lost in transit by the shipping vendor. We were not notified of the issue until after the monitoring period had ended. We received a tier 3 violation for failure to provide disinfection byproduct test results for the second quarter of 2024. You can find the violation notice on the last two pages of this report.
For any questions about or if you wish to receive a paper copy of this report, please call 252-551-1551. You may also request a copy of the report by emailing us.
We welcome questions and feedback, or any general inquiries you may have. Please contact us at (252) 551-1551.
The highly-trained, state-certified staff at our Water Treatment Plant (WTP) continuously monitors the treatment process to ensure our water quality meets regulatory requirements. More than 100,000 tests are performed on hundreds of substances each year to ensure that your drinking water is safe. The WTP currently has the capacity to treat 32.0 million gallons per day (mgd). During 2024, GUC treated an average of (14.8) million gallons of water a day.
GUC met or surpassed all federal and state drinking water standards. GUC is committed to providing the highest quality drinking water to our customers. GUC was awarded its 9th consecutive Area Wide Optimization Award and the Partnership for Safe Water Directors Award in 2024. Both programs set water quality goals that are more stringent than EPA drinking water regulations.
We welcome questions and feedback, or any general inquiries you may have. Please contact us at (252) 551-1551.
We Treat More Than 14.8 Million Gallons Of Water Each Day Serving More Than 140,000 People.
Drinking water, including bottled water, may reasonably be expected to contain at least small amounts of some contaminants. The presence of contaminants does not necessarily indicate that water poses a health risk.
More information about contaminants and potential health effects can be obtained by calling the Environmental Protection Agency’s (EPA) Safe Drinking Water Hotline (800-426-4791).
Some people may be more vulnerable to contaminants in drinking water than the general population.
Immunocompromised persons such as persons with cancer undergoing chemotherapy, persons who have undergone organ transplants, people with HIV/AIDS or other immune system disorders, some elderly, and infants can be particularly at risk from infections. These people should seek advice about drinking water from their healthcare providers.
EPA/Center For Disease Control (CDC) guidelines on appropriate means to lessen the risk of infection by Cryptosporidium and other microbial contaminants are available from the Safe Drinking Water Hotline (800-426-4791).
Drinking water sources (tap and bottled) include rivers, lakes, streams, ponds, reservoirs, springs, and wells. As water travels, it can dissolve minerals, radioactive material, and pick up contaminants from animal or human activity. The EPA regulates contaminant levels in public tap water, while the Food and Drug Administration (FDA) sets similar limits for bottled water to ensure safety.
Beginning in February 2023, our water distribution crews inspected all of the water service lines on our system made of an unknown material type as part of the EPA’s Lead and Copper Rule Revisions (LCRR). The goal was to identify and replace any water lines made of lead.
Crews worked with GUC’s Geographic Information Systems (GIS) staff and conducted site surveys to examine both sides of the meter for homes built before 1986. We are happy to report that the survey of both GUC and customer water lines revealed zero lead service lines on either side.
For more information about the service line inventory and to see an interactive map showing the results of the materials found, visit https://www.guc.com/water-service-line-inventory.
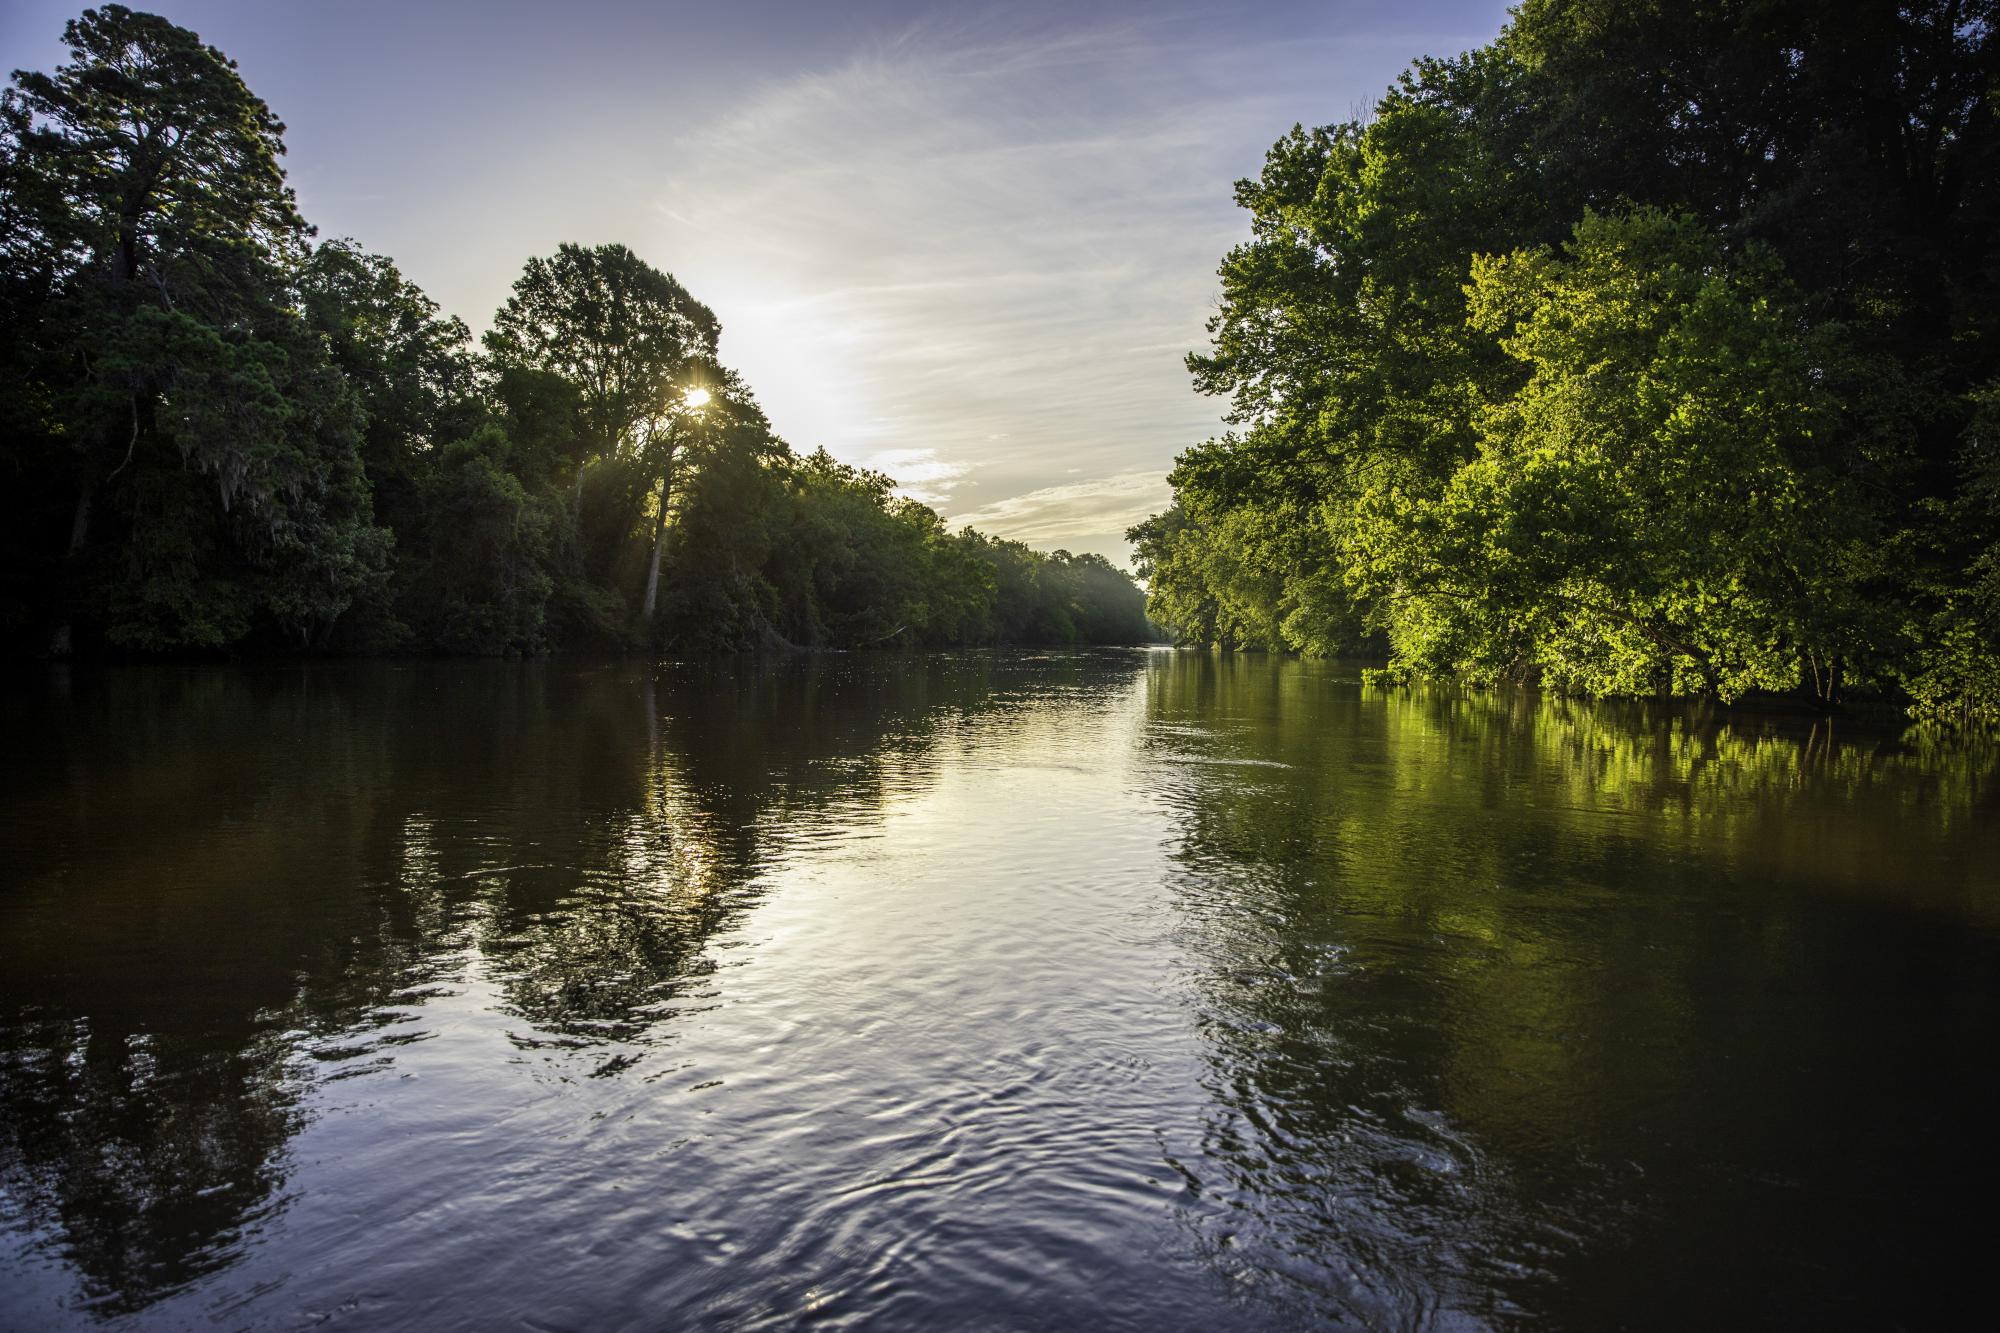
GUC’s Water Treatment Plant receives its water from the Tar River, which is classified as a surface water supply.
Additionally, three area deep wells supplement the surface water supply (four wells supplement Bethel).
The NC Department of Environmental Quality (DEQ), Public Water Supply (PWS) section’s Source Water Assessment Program (SWAP) conducted assessments for all drinking water sources across North Carolina.
The purpose of the assessments was to determine the susceptibility of each drinking water source (well or surface water intake) to Potential Contaminants Sources (PCSs). The results of the assessment are available in the SWAP Assessment Reports that include maps, background information and a relative susceptibility rating of Higher, Moderate or Lower.
The relative susceptibility rating of each source for Greenville Utilities was determined by combining the contaminant rating (number and location of PCSs within the assessment area) and the inherent vulnerability rating (i.e., characteristics or existing conditions of the well or watershed and its delineated assessment area). The assessment findings are summarized in the table below.
The report for GUC may be viewed on the web at: https://www.ncwater.org/?page=600. To obtain a printed copy of this report, please mail a written request to: Source Water Assessment Program, Report Request, 1634 Mail Service Center, Raleigh NC 27699- 1634, or email a request to swap@deq.nc.gov. If you have any questions about the SWAP report, please contact the Source Water Assessment Program by phone at (919) 715-2633.
A susceptibility rating of “higher” does not imply poor water quality, only the system’s potential to become contaminated by PCSs in the assessment area.
Source Water Assessment Program Findings
Greenville Utilities has four water sources from which to draw, five for Bethel: the Tar River (Water Treatment Plant) and four wells located throughout GUC’s system.
Susceptibility | Water Resources |
Higher | Water Treatment Plant |
Moderate | WSWWell, SSW Well, EPW Well, Hwy 11 (Bethel) |
Water from the Tar River is pumped into a 63-million- gallon pre-settling reservoir where large, heavy dirt particles begin to settle out as the water slowly moves to the outlet of the reservoir. From there, the water flows to the Plant in one of two paths. The first is the original section of the Plant where a coagulant (chemical to help smaller dirt particles come together to form larger particles called floc) is added. The water then passes through a series of mixers, called flocculators, designed to facilitate the formation of floc.
After the mixers, the water slows to a snail’s pace as it enters the sedimentation basins. As it passes through the basins, about 95% of the floc settles to the bottom. The cleaner water from the top of the basin is then combined with water from the new superpulsator.
The second path is to the new superpulsator. The superpulsator, which is a high-rate sludge blanket clarifier combining inclined plate settling, pulsing sludge blanket, and solids contact to achieve maximum efficiency.
This expansion project was completed in 2023 and is able to treat up to 10 million gallons each day. The superpulsator clarifier combines basic chemical principles and proven clarification technology in a high-rate, solids contact clarifier that offers maximum efficiency. The unique design combines flocculation and clarification functions in one basin for optimal use of space.
Vacuum generated flow pulsations create a homogeneous sludge blanket that results in excellent effluent quality at minimal operating costs. Once water is through the superpulsator, it is then combined with water from the older basins and channeled to ozone tanks where it is ozonated. This part of the process is called primary disinfection. Harmful bacteria, germs, viruses and microorganisms are killed or inactivated by this process.
Next, the water is filtered where a majority of the remaining particles are removed. Additional chemical treatment happens next. Fluoride is added to help prevent tooth decay, sodium hydroxide (caustic) is added to increase pH, phosphate is added for corrosion control and chlorine and ammonia are added to form chloramines, which function as the secondary disinfection in the distribution system.
Finished water is then pumped into three, 3,000,000-gallon ground storage tanks and into the
distribution system, which includes two elevated tanks as well as our customers’ homes and businesses.
Listed are substances detected in GUC’s treated water during 2024, unless otherwise noted. Not listed are other substances that were tested for (i.e., MTBE, Mercury, Petroleum products, etc.), but were not detected.
Substances | Highest Level Allowed [MCL] | Highest Level Detected | Range Detected | Description and Origin of Substance | Ideal Goals [MCLG] |
Asbestos (MFL) | 7.0 | <0.16 | n/a | Decay of asbestos cement water mains; erosion of natural deposits | 0.0 |
Bromate (ppb) | 10.0 (Running Annual Average) | <1.0 (Running Annual Average) | n/a (Highest and lowest site value) | By-productof drinking waer disinfection. | 0.0 |
Chloramines (ppm) | 4.0 (Running Annual Average) | 2.77 (System Average) | 4.3 - 1.0 (Highest and lowest site value) | Water additive used to control microbes | 4.0 |
Chlorine (ppm) | 4.0 (Running Annual Average) | 1.99 (System Average) | 3.2 - .06 (Highest and lowest site value) | Water additive used to control microbes | 4.0 |
Fluoride (ppm) | 4.0 | 0.7 | n/a | Natural occurring mineral; also added to water to promote dental health. | 4.0 |
Haloacetic Acid (ppb) | 60.0 (Locational Running Annual Average) | 35 (Highest Locational Running Annual Average) | 53 - 12 (Highest and lowest site value) | By-productof drinking water chlorination | n/a |
Total Coliform | Presence of coliform bacteria in >5% of monthly samples | n/a | n/a | Naturally present in the environment. | 0.0 |
Total Organic Carbon Treated (ppm) | TT no violation | 3.8 | 3.8 - 2.6 (Highest and lowest site value) | Naturally present in the environment. | n/a |
Trihalomethanes (ppb) | 80.0 (Locational Running Annual Average) | 36 (Highest Locational Running Annual Average) | 53 - 12 (Highest and lowest site value) | By-product of drinking water chlorination | n/a |
Turbidity (NTU) | 1.0 and 95% of samples below 0.3 (Treatment Technique) | 0.14 and 100 % of samples below 0.3 | n/a | Turbidity is a measure of cloudiness in water. It may be caused by inorganic soil particles or fragments of organic matter that can interfere with treatment. | 0.3 |
Lead (ppb) No sample site exceeded the action level (2024) | 15.0 (Action Level) | 0.0 (90th percentile) | 0-0 | Lead occursnaturally in the environment, but can be present in drinking water due corrosion of private household plumbing. | 0 |
Copper (ppm) No samplesite exceeded the action level (2024) | 1.3 (Action Level) | 0.2 (90th percentile) | 0-0.3 | Copper occurs naturally in the environment, but can be present in drinking water due corrosion of private household plumbing. | 0 |
Radiological Contaminants (This sampling event represents Greenville Utilities Well Sites that were not actively utilized to provide water to the distribution system in 2024).
Contaminant (Units) | Sample Date | MCL Violation | Your Water [RAA] | Range Low - High | MCLG | MCL | Likely Source of Contamination |
| Beta/Photon Emitters (pCi/L) | 10/24/24 | N | 10.2 | 7.9 - 10.2 | 0 | 50.0* (Action Level) | Decay of natural and man-made deposits |
*Note: The MCL for beta/photon emitters is 4 mrem/year. EPA considers 50 pCi/L to be the level of concern for beta particles.
Listed are substances detected in Bethel’s treated water during 2024, unless otherwise noted. Not listed are other substances that were tested for (i.e., MTBE, Mercury, Petroleum products, etc.), but were not detected.
Substances | Highest Level Allowed [MCL] | Highest Level Detected | Range Detected | Description and Origin of Substance | Ideal Goals [MCLG] |
Asbestos (MFL) | 7.0 | <0.16 | n/a | Decay of asbestos cement water mains; erosion of natural deposits | 0.0 |
Bromate (ppb) | 10.0 (Running Annual Average) | <1.0 (Running Annual Average) | n/a (Highest and lowest site value) | By-productof drinking waer disinfection. | 0.0 |
Chloramines (ppm) | 4.0 (Running Annual Average) | 2.16 (System Average) | 3.3 - 1.0 (Highest and lowest site value) | Water additive used to control microbes | 4.0 |
Chlorine (ppm) | 4.0 (Running Annual Average) | 2.15 (System Average) | 2.3 - 2.0 (Highest and lowest site value) | Water additive used to control microbes | 4.0 |
Fluoride (ppm) | 4.0 | 0.7 | n/a | Natural occurring mineral; also added to water to promote dental health. | 4.0 |
Fluoride (ppm) in Highway 11 well. This well did not provide water to Bethel in 2024. | 4.0 | 1.59 | n/a | Natural occurring mineral; also added to water to promote dental health. | 4.0 |
Haloacetic Acid (ppb) | 60.0 (Locational Running Annual Average) | 27.0 (Highest Locational Running Annual Average) | 52 - 15 (Highest and lowest site value) | By-productof drinking water chlorination | n/a |
Total Coliform | Presence of coliform bacteria in >5% of monthly samples | n/a | n/a | Naturally present in the environment. | 0.0 |
Total Organic Carbon Treated (ppm) | TT no violation | 3.8 | 3.8 - 2.6 (Highest and lowest site value) | Naturally present in the environment. | n/a |
Trihalomethanes (ppb) | 80.0 (Locational Running Annual Average) | 28 (Highest Locational Running Annual Average) | 51 - 15 (Highest and lowest site value) | By-product of drinking water chlorination | n/a |
Turbidity (NTU) | 1.0 and 95% of samples below 0.3 (Treatment Technique) | 0.14 and 100 % of samples below 0.3 | n/a | Turbidity is a measure of cloudiness in water. It may be caused by inorganic soil particles or fragments of organic matter that can interfere with treatment. | 0.3 |
Lead (ppb) No sample site exceeded the action level (2024) | 15.0 (Action Level) | 0.0 (90th percentile) | 0-0.0 | Lead occursnaturally in the environment, but can be present in drinking water due corrosion of private household plumbing. | 0 |
Copper (ppm) No samplesite exceeded the action level (2024) | 1.3 (Action Level) | 0.2 (90th percentile) | 0.4-0.0 | Copper occurs naturally in the environment, but can be present in drinking water due corrosion of private household plumbing. | 0 |
Radiological Contaminants (This sampling event represents Greenville Utilities Well Sites that were not actively utilized to provide water to the distribution system in 2024).
Contaminant (Units) | Sample Date | MCL Violation | Your Water [RAA] | Range Low - High | MCLG | MCL | Likely Source of Contamination |
| Beta/Photon Emitters (pCi/L) | 10/24/24 | N | 10.2 | 7.9 - 10.2 | 0 | 50.0* | Decay of natural and man-made deposits |
*Note: The MCL for beta/photon emitters is 4 mrem/year. EPA considers 50 pCi/L to be the level of concern for beta particles.
Note About Lead From Chart
Lead can cause serious health problems, especially for pregnant women and young children. Lead in drinking water is primarily from materials and components associated with service lines and home plumbing.
Greenville Utilities is responsible for providing high quality drinking water and removing lead pipes, but cannot control the variety of materials used in plumbing components in your home. You share the responsibility for protecting yourself and your family from the lead in your home plumbing.
You can take responsibility by identifying and removing lead materials within your home plumbing and taking steps to reduce your family's risk. Before drinking tap water, flush your pipes for several minutes by running your tap, taking a shower, doing laundry or a load of dishes. You can also use a filter certified by an American National Standards Institute accredited certifier to reduce lead in drinking water.
If you are concerned about lead in your water and wish to have your water tested, contact GUC at 252-551-1551. Information on lead in drinking water, testing methods, and steps you can take to minimize exposure is available at http://www.epa.gov/safewater/lead(opens in a new tab).
Every five years, the EPA issues the UCMR, a list of unregulated contaminants to be monitored by public water systems. The first UCMR was issued in September 1999.
Through the UCMR, public water systems provide the EPA data about the presence of these unregulated contaminants in drinking water. The data allows the EPA to determine if the population is being exposed, quantify the level of exposure, and assess the impact of these unregulated contaminants on the environment and public health. This is the first step in the EPA’s process to determine what new contaminants may need to be regulated.
For more information, visit the EPA website at water.epa.gov.
Substances | Highest Level Detected | Range Detected | Description and Origin Substance | |
Lithium (ppb) | <9 | <9 | Metal, pharmaceutical. Used as anode in electrochemical cells and batteries; as chemical intermediate in organic syntheses | |
Perfluorooctanoic Acid (PFOA) (ppt) | 7.6 | <4 - 7.6 | Per- and Polyfluoroalkyl Substances (PFAS)are a class of man-made chemicals used for consumer product applications such as waterproof and stainproof fabrics, nonstick cookware, some food packaging materials, and fire suppression foams. | HAL 70 ppt |
Perfluorooctanesulfonic Acid (PFOS) (ppt) | 6.3 | <4 - 6.3 | ||
Perfluorononanoic Acid (PFNA) (ppt) | <4 | <4 | ||
Perfluorohexanesulfonic Acid (PFHxS) (ppt) | <4 | <4 | ||
Perfluorobutanesulfonic Acid (PFBS) (ppt) | 6.1 | <4 - 6.1 | ||
Hexafluoropropylene Oxide Dimer Acid (HFPO-DA) (GEN X) (ppt) | <4 | <4 | ||
Perfluorobutanoic Acid (PFBA) (ppt) | 6.9 | <4 - 6.9 | ||
Perfluoropentanoic Acid (PFPeA) (ppt) | 5.1 | <4 - 5.1 | ||
Perfluorohexanoic Acid (PFHxA) (ppt) | 5.1 | <4 - 5.1 | ||
The WTP uses chloramines as its secondary disinfectant. Chloramines are intended to form fewer chemicals (by-products) in water, improve the taste and odor of water (compared to chlorine), and last longer in the distribution system to prevent bacterial growth.
Chloraminated water is safe for bathing, drinking, cooking and all uses we have for water every day. However, there are two groups of people who need to take special care with chloraminated water: kidney dialysis patients and fish owners. Just like chlorine, chloramines must be removed from water used in kidney dialysis machines. If you are a dialysis patient or have questions, please call your physician or dialysis center.
Like chlorine, chloramines are toxic to fish. Fish owners need to remove chlorine, ammonia and chloramines from the water before use with tropical fish. Local pet stores carry water conditioners that remove chloramines. If you have questions, contact your pet store for information and detailed instructions. For further information about chloramines and chlorine, please call (252) 551-1551.
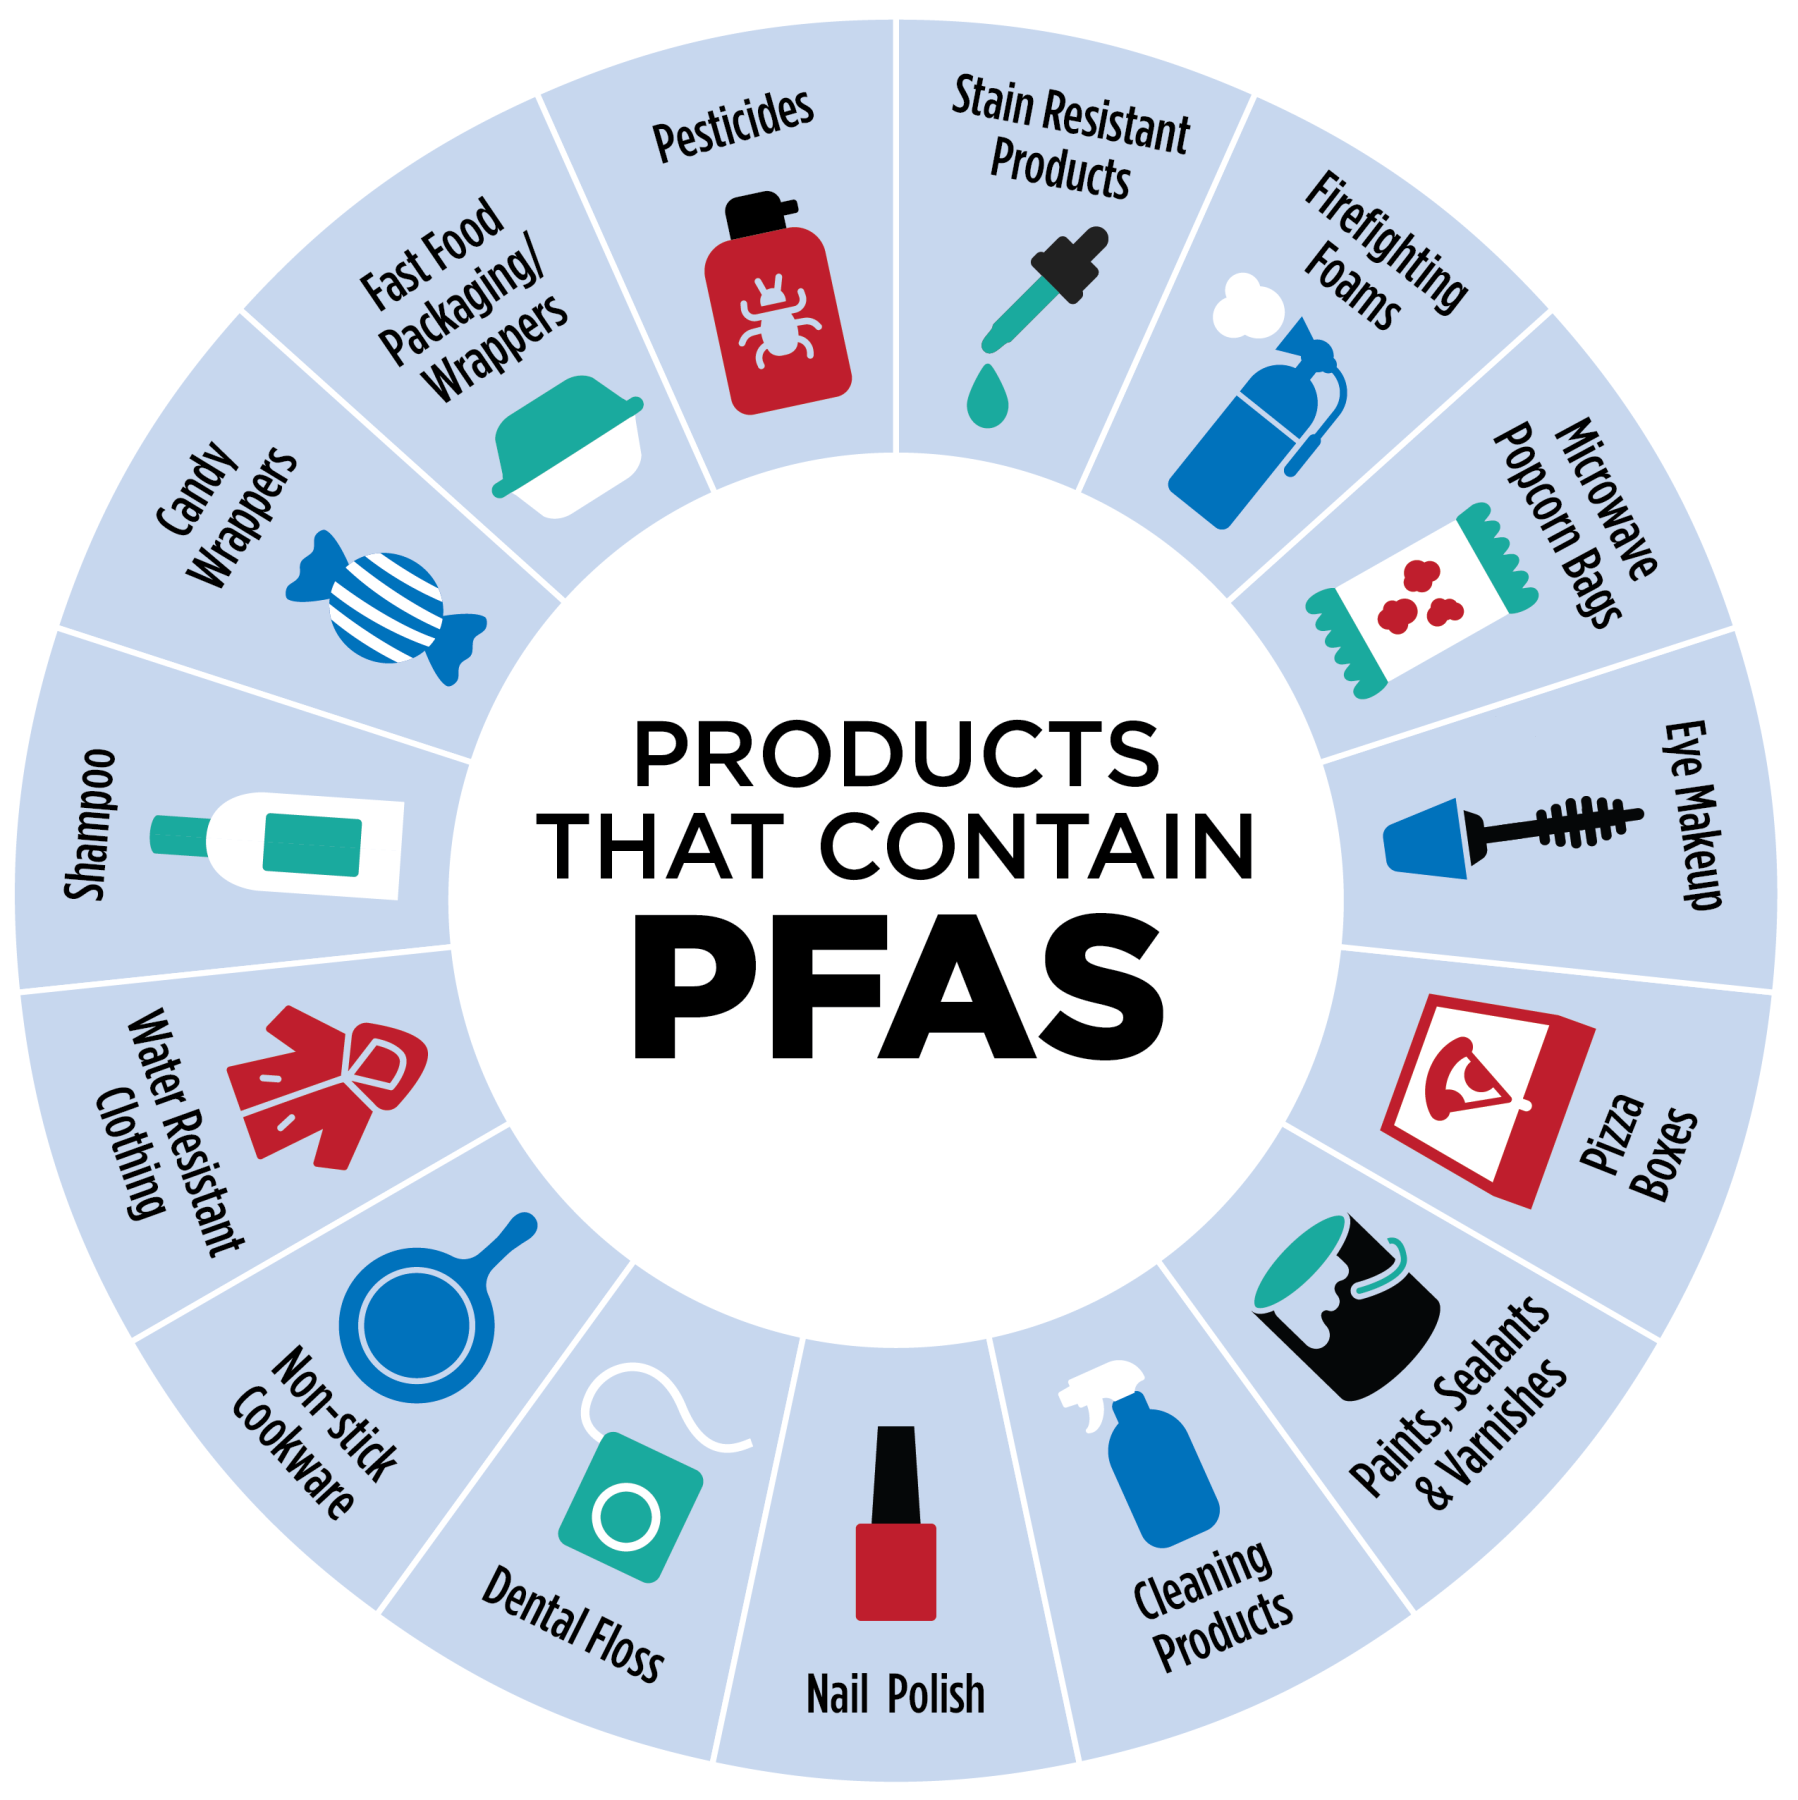
Per- and polyfluoroalkyl substances (PFAS) are a group of more than 12,000 human-made substances that are not naturally-occurring and are resistant to heat, water, and oil. These include PFOA, PFOS, GenX, and many other chemicals. PFAS have been manufactured and used in a variety of industries around the globe, including the United States since the 1940s. Products using PFAS include everything from carpet to clothing, from food packaging to cookware, from chrome plating to firefighting foam.
In typical conditions, PFAS are resistant to degradation and do not break down in the environment. These substances can accumulate within the human body and are toxic at relatively low concentrations.
 Two types of PFAS are no longer manufactured or imported into the US, though there could be some imported goods that contain these substances. Other PFAS-containing goods and materials are still being produced and used in the US. Exposure to unsafe levels of PFOA and PFOS may result in adverse health effects including developmental effects to fetuses during pregnancy, cancer, liver effects, immune effects, thyroid effects, and other effects (such as cholesterol changes). PFOA and PFOS have been found in the blood of nearly all people tested across several national studies. According to the Centers for Disease Control and Prevention (CDC), levels of both PFOA and PFOS have steadily decreased in the US since 1999-2000.
In 2016, the EPA issued Health Advisory Levels (HALs) for PFAS compounds as the first step in developing new drinking water standards. The EPA established a level of 70 parts per trillion (ppt) as the HAL level. GUC has been voluntarily testing for these substances since 2018. Each time GUC has tested for these substances, all levels were well below the EPA’s advisory level.
In 2023, the EPA proposed, and then confirmed in April of 2024, a new regulation of PFAS and PFOA with maximum contaminant levels set at 4 ppt, which is drastically lower than the HAL of 70 ppt and is the equivalent of 4 drops of water in 10 million gallons (or 20 Olympic-size swimming pools).
GUC will continue testing and monitoring both river and treated water for a variety of substances to ensure we provide safe, award-winning drinking water for the Greenville Region and will comply with all regulations the State and Federal governments adopt.
Some people may be more vulnerable to contaminants in drinking water than the general population. Immuno-compromised persons such as those undergoing chemotherapy, organ transplant patients, people with HIV/AIDS or other immune system disorders, some elderly, and infants can be particularly at risk for infections. These people should seek advice about drinking water from their healthcare providers. EPA/Center for Disease Control guidelines on appropriate means to lessen the risk of infection by cryptosporidium and other microbial contaminants are available from the Safe Drinking Water Hotline, 1-800-426-4791.
Greenville Utilities embarked on an inspection and recoating of the Eastside Water Tower in 2024. The process entails draining the water out of the million-gallon tank, inspecting it for issues and measuring the paint thickness to determine if recoating is necessary.
Crews pressure washed the interior and sandblasted as necessary before repainting both the inside and outside of the tank. The last time this tower was recoated was in 2009. The process took eight weeks to complete and included a new GUC logo on the exterior.
We provide tours of the WTP and make presentations to groups, including civic organizations and schools. We also have a variety of educational brochures available upon request. Please contact us at (252) 551-1562 for more information. Our Board of Commissioners meets on the third Thursday of every month at noon, except in June. Meetings are typically held in the Board Room on the second floor of our Main Office, 401 South Greene Street. The public is welcome to attend.
All customers expect their water to be clean and safe. That is why GUC makes sure the water delivered to each customer is of the highest quality. When water leaves the WTP, it is at its freshest and purest. One of the ways GUC safeguards the water delivered to customers is through the cross-connection control program. This program is designed to prevent contamination of the public water system through an unprotected cross-connection. Whether these connections are permanent or temporary, they can be dangerous and could contaminate or pollute the public water system through backflow. Protective measures must be taken to prevent this potential backflow hazard.
Federal law requires GUC to protect the water supply from potential contamination or pollution. To do this, all industrial, most commercial and all irrigation customers are required to install backflow prevention assemblies. These assemblies must be installed before any branching of the customer’s plumbing can occur. Different types of backflow preventers are required depending on the hazard.
Severe hazards exist when there is potential that backflow could create a health threat. Lawn irrigation systems, hospitals, medical offices and manufacturing plants using chemicals are some examples of a severe hazard. Moderate hazards exist from a backflow occurrence that causes discolored or aesthetically objectionable water, but is not a health threat.
Restaurants and convenience stores are examples of moderate hazards.
Facilities on GUC’s public water system are evaluated to determine which hazard(s), if any, may potentially exist and the type of backflow prevention assembly that is required. After an approved backflow prevention assembly has been installed and tested, it must be re-tested annually. Only individuals who have been certified through a GUC-approved testing school can test backflow assemblies.
Greenville Utilities constructed a backflow testing lab to ensure contractors and plumbers have the knowledge and skills needed to install and test backflow assemblies. Opened in March 2008, the Lab is housed in its own building on the grounds of the WTP and provides a site for quarterly recertification classes and bi-annual training classes. For more information on the Cross-Connection Control Program, call (252) 551-1551.
Save Water and Money—Use Water Wisely:
Repair all leaks and drips. At one drop per second, a leaky faucet wastes nearly 2,500 gallons/year–enough water for 160 full dishwasher cycles.
Limit showers to five minutes or less.
Catch water in an empty tuna can to measure sprinkler output. 3/4 to 1 inch of water is enough to apply each time you irrigate.
Ensure sprinklers water only the landscape, not driveways/streets.
To Properly Dispose of Hazardous Products:
Motor Oil/Batteries: Take to the Pitt County Landfill on Allen Road, (252) 902-3350.
Paint: Remove container lid and let paint harden completely. Containers with lids removed will be collected curbside.
Pesticides/Herbicides: Contact North Carolina Cooperative Extension Service at (252) 902-1700.
You can prevent sanitary sewer overflows by disposing of cooking oils and grease as solid waste in your home garbage collection.
Action Level – The concentration of a contaminant which, if exceeded, triggers additional treatment measures by the public water system.
Contaminant – any physical, chemical, biological or radiological substance or matter in water. Drinking water may reasonably be expected to contain at least small amounts of some contaminants. Some contaminants may be harmful if consumed at certain levels in drinking water.
HAL (Health Advisory Level) – The reference level of chemical traces (usually in ppm) in drinking water at which there are no adverse health risks when ingested over various periods of time.
Herbicides – chemicals used to manipulate or control undesirable vegetation.
Locational Running Annual Average – The average of sample analytical results for samples taken at a particular monitoring location during the previous four calendar quarters under the Stage 2 Disinfectants and Disinfection Byproducts Rule.
Maximum Contaminant Level (MCL) – The highest level of a contaminant allowed in drinking water. MCLsare set as close to the MCLGs as feasible using the best available treatment technique.
Maximum Contaminant Level Goal (MCLG) – The level of a contaminant in drinking water below which there is no known or expected risk to health. MCLGs allow for a margin of safety.
Maximum Residual Disinfectant Level (MRDL) – The highest level of a disinfectant allowed in drinking water. There is convincing evidence that addition of a disinfectant is necessary for control of microbial contaminants.
Maximum Residual Disinfection Level Goal (MRDLG) – The level of a drinking water disinfectant below which there is no known or expected risk to health. MRDLGs do not reflect the benefits of the use of disinfectants to control microbial contaminants.
Nephelometric Turbidity Units (NTU) – Turbidity is a measure of cloudiness in water.
Ninetieth Percentile – The concentration value exceeding the lower ninety percent of samples analyzed and exceeded by the upper ten percent.
Parts Per Billion (ppb) – One part per billion is comparable to one minute in two thousand years or one penny in $10,000,000.
Parts Per Million (ppm) – Equivalent to milligrams per liter. One part per million is comparable to one minute in two years, or one penny out of $10,000.
Pesticide – any substance or mixture of substances intended for preventing, destroying, repelling, or mitigating any pest; or any substance or mixture of substances intended for use as a plant regulator, defoliant, or desiccant; or any nitrogen stabilizer.
Picocuries Per Liter (pCi/L) – A measurement of radioactivity per liter.
Treatment Techniques (TT) – A required process intended to reduce the level of contaminants.
> – is greater than; < – is less than.
Environmental Protection Agency
Ariel Rios Building, 1200 Pennsylvania Avenue NW Mail Code 3213A
Washington, DC 20460
(202) 260-2090 (fax)
www.epa.gov(opens in a new tab)
Safe Drinking Water Hotline
(800) 426-4791
NC Department of Environmental Quality
1601 Mail Service Center Raleigh, NC 27699-1601
(919) 733-4984
American Water Works Association
6666 West Quincy Avenue Denver, CO 80235
(800) 926-7337
www.awwa.org(opens in a new tab)
www.waterwiser.org(opens in a new tab)
Greenville Utilities
PO Box 1847
Greenville, NC 27835-1847
(252) 551-1551